OverviewMicrometer is a metrics instrumentation library for JVM-based applications that Apache CXF provides the support for. Starting from Micrometer 1.10, Micrometer provides the Observation API and a plugin mechanism that allows to add capabilities including the tracing features. Starting from 4.0.3 release, the Apache CXF fully supports integration (through cxf-integration-tracing-micrometer module) with Micrometer Tracing distributed tracing capabilities using Micrometer Observation APIs. The section dedicated to Apache HTrace has pretty good introduction into distributed tracing, however Micrometer Observation uses own, more generic, terminology and provides the general APIs to denote the Observation lifecycle (which somewhat is analogous to Span) and injection points to propagate the context across many distributed components. As such, the intrinsic details about HTTP headers f.e. becomes an integral part of the distributed tracer of your choice, out of reach for Apache CXF. Micrometer Tracing provides a simple facade for the most popular tracer libraries, letting to implement the instrumentation of the JVM-based application code without vendor lock-in. It is designed to add little to no overhead to the tracing collection activity while maximizing the portability of the tracing efforts. Distributed Tracing in Apache CXF using Micrometer ObservationThe current integration of the Micrometer Observation's distributed tracing in Apache CXF supports Micrometer Observation 1.10.x / Micrometer Tracing 1.0.x and provides full-fledged support of JAX-RS 2.x / JAX-WS applications. From high-level prospective, the JAX-RS integration consists of three main parts:
Similarly, from high-level perspective, JAX-WS integration includes:
Apache CXF uses HTTP headers to hand off tracing context from the client to the service and from the service to service. Those headers are specific to distributing tracing framework you have picked and are not configurable at the moment (unless the framework itself has a way to do that). By default, ObservationClientProvider will use configured propagators to pass the currently active observation through HTTP headers on each service invocation. If there is no active observations, the new observation will be created and passed through HTTP headers on per-invocation basis. Essentially, for JAX-RS applications just registering ObservationClientProvider on the client and ObservationProvider on the server is enough to have tracing context to be properly passed everywhere. The only configuration part which is necessary are span reporter(s) / exporter(s) and sampler(s) which are, not surprisingly, specific to distributing tracing bridge you have chosen. It is also worth to mention the way Apache CXF attaches the description to observations (spans). With regards to the client integration, the description becomes a full URL being invoked prefixed by HTTP method, for example: GET http://localhost:8282/books. On the server side integration, the description becomes a relative JAX-RS resource path prefixed by HTTP method, f.e.: GET books, POST book/123 Configuring ClientThere are a couple of ways the JAX-RS client could be configured, depending on the tracing bridge you want to use (see please Configuring with Micrometer Observation). The Apache CXF provides its own WebClient which could be configured just like that (in future versions, there would be a simpler ways to do that using client specific features): final ObservationRegistry observationRegistry = ObservationRegistry.create();
final Tracer tracer = <create tracer using tracing bridge>;
final Propagator propagator = <create propagator using tracing bridge;
observationRegistry.observationConfig().observationHandler(
new FirstMatchingCompositeObservationHandler(
new PropagatingSenderTracingObservationHandler<>(tracer, propagator),
new PropagatingReceiverTracingObservationHandler<>(tracer, propagator),
new DefaultTracingObservationHandler(tracer)
)
);
Response response = WebClient
.create("http://localhost:9000/catalog", Arrays.asList(new ObservationClientProvider(observationRegistry))
.accept(MediaType.APPLICATION_JSON)
.get();
Configuring ServerServer configuration is a very similar to the client one and uses ObservationFeature, but still requires the tracing bridge configuration (see please Configuring with Micrometer Observation). Depending on the way the Apache CXF is used to configure JAX-RS services, it could be part of JAX-RS application configuration, for example: @ApplicationPath("/")
public class CatalogApplication extends Application {
@Override
public Set<Object> getSingletons() {
final ObservationRegistry observationRegistry = ObservationRegistry.create();
final Tracer tracer = <create tracer using tracing bridge>;
final Propagator propagator = <create propagator using tracing bridge;
observationRegistry.observationConfig().observationHandler(
new FirstMatchingCompositeObservationHandler(
new PropagatingSenderTracingObservationHandler<>(tracer, propagator),
new PropagatingReceiverTracingObservationHandler<>(tracer, propagator),
new DefaultTracingObservationHandler(tracer)
)
);
return new HashSet<>(
Arrays.asList(
new ObservationFeature(observationRegistry)
)
);
}
}
Or it could be configured using JAXRSServerFactoryBean as well, for example: final ObservationRegistry observationRegistry = ObservationRegistry.create();
final Tracer tracer = <create tracer using tracing bridge>;
final Propagator propagator = <create propagator using tracing bridge;
observationRegistry.observationConfig().observationHandler(
new FirstMatchingCompositeObservationHandler(
new PropagatingSenderTracingObservationHandler<>(tracer, propagator),
new PropagatingReceiverTracingObservationHandler<>(tracer, propagator),
new DefaultTracingObservationHandler(tracer)
)
);
final JAXRSServerFactoryBean factory = RuntimeDelegate.getInstance().createEndpoint(/* application instance */, JAXRSServerFactoryBean.class);
factory.setProvider(new ObservationFeature(observationRegistry));
...
return factory.create();
Once the span processor(s) / reporter(s) and sampler are properly configured, all generated observations (spans) are going to be collected and available for analysis and/or visualization. Distributed Tracing In Action: Usage ScenariosIn the following subsections we are going to walk through many different scenarios to illustrate the distributed tracing in action, starting from the simplest ones and finishing with asynchronous JAX-RS services. All examples assume that configuration has been done (see please Configuring Client and Configuring Server sections above). In this example, both client and server use OpenTelemetry tracing bridge (see please Configuring with Micrometer Observation for more details): final Resource resource = Resource.getDefault().merge(
Resource.create(Attributes.of(ResourceAttributes.SERVICE_NAME, "...")));
final SdkTracerProvider sdkTracerProvider = SdkTracerProvider.builder()
.addSpanProcessor(BatchSpanProcessor.builder(OtlpGrpcSpanExporter.builder().build()).build())
.setSampler(Sampler.alwaysOn())
.setResource(resource)
.build();
final OpenTelemetrySdk openTelemetrySdk = OpenTelemetrySdk.builder()
.setTracerProvider(sdkTracerProvider)
.setPropagators(ContextPropagators.create(W3CTraceContextPropagator.getInstance()))
.buildAndRegisterGlobal();
final OtelCurrentTraceContext bridgeContext = new OtelCurrentTraceContext();
final io.opentelemetry.api.trace.Tracer otelTracer = openTelemetrySdk.getTracer("...");
final OtelPropagator propagator = new OtelPropagator(ContextPropagators.create(
TextMapPropagator.composite(W3CTraceContextPropagator.getInstance())), otelTracer);
final Slf4JEventListener slf4JEventListener = new Slf4JEventListener();
final Slf4JBaggageEventListener slf4JBaggageEventListener = new Slf4JBaggageEventListener(Collections.emptyList());
final ObservationRegistry observationRegistry = ObservationRegistry.create();
final OtelTracer tracer = new OtelTracer(otelTracer, bridgeContext, event -> {
slf4JEventListener.onEvent(event);
slf4JBaggageEventListener.onEvent(event);
});
observationRegistry.observationConfig().observationHandler(
new FirstMatchingCompositeObservationHandler(
new PropagatingSenderTracingObservationHandler<>(tracer, propagator),
new PropagatingReceiverTracingObservationHandler<>(tracer, propagator),
new DefaultTracingObservationHandler(tracer)
)
);
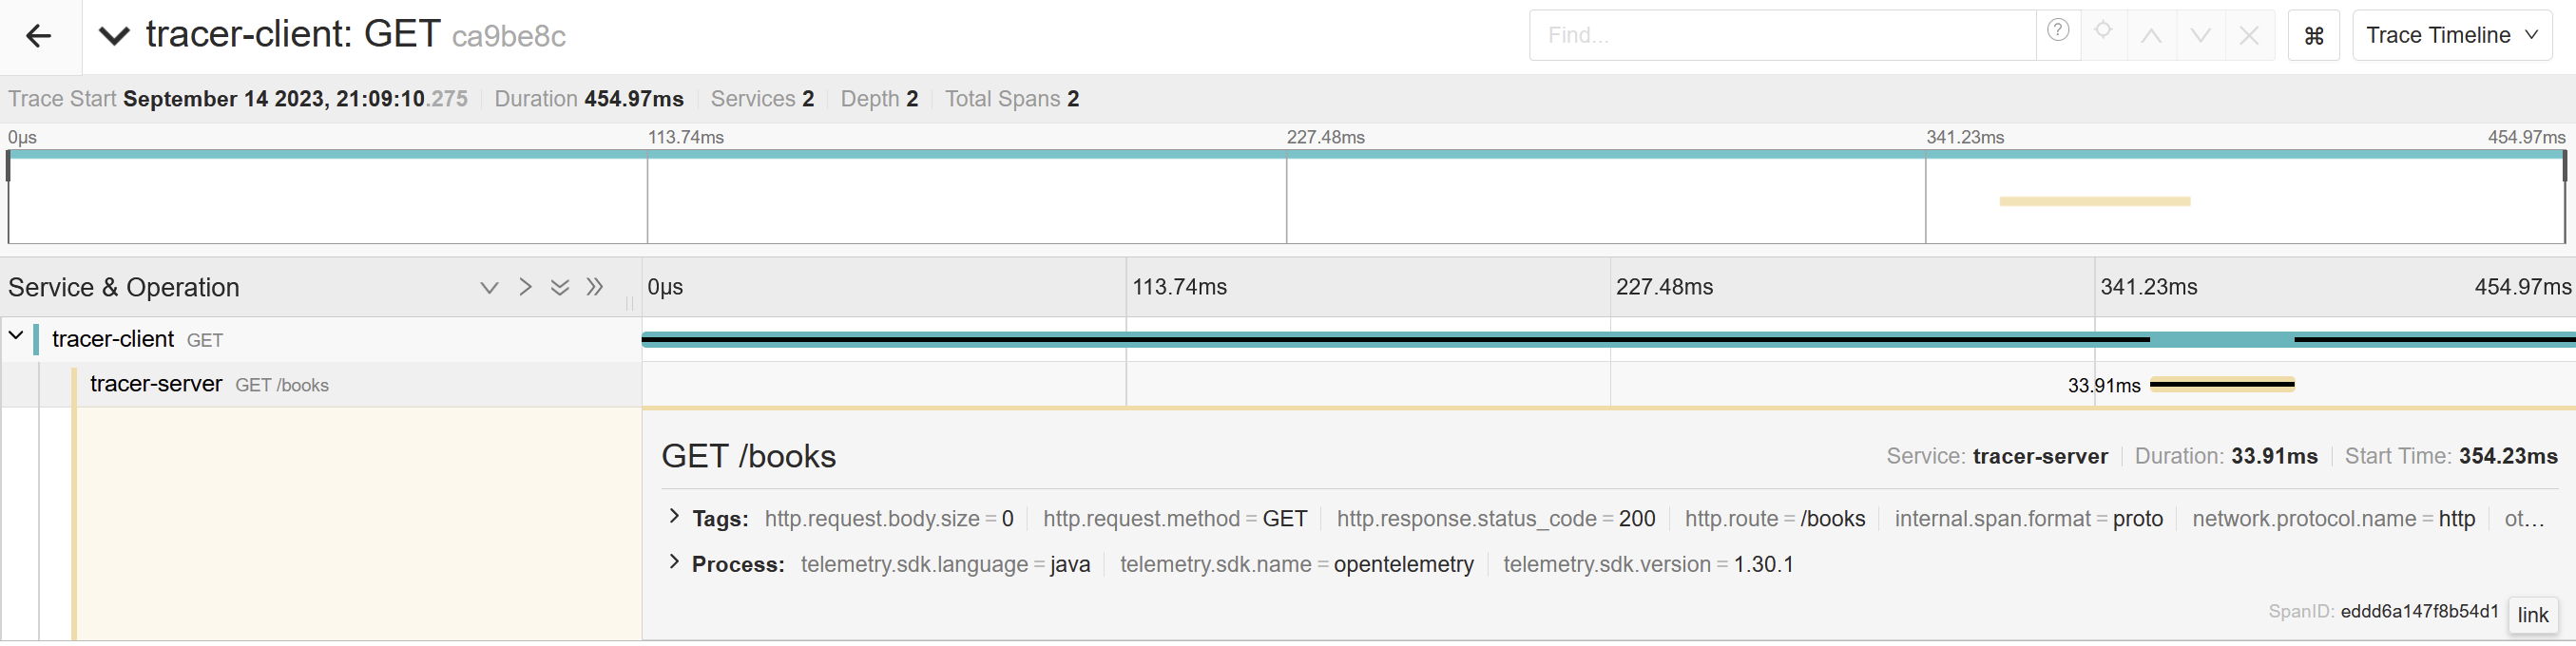
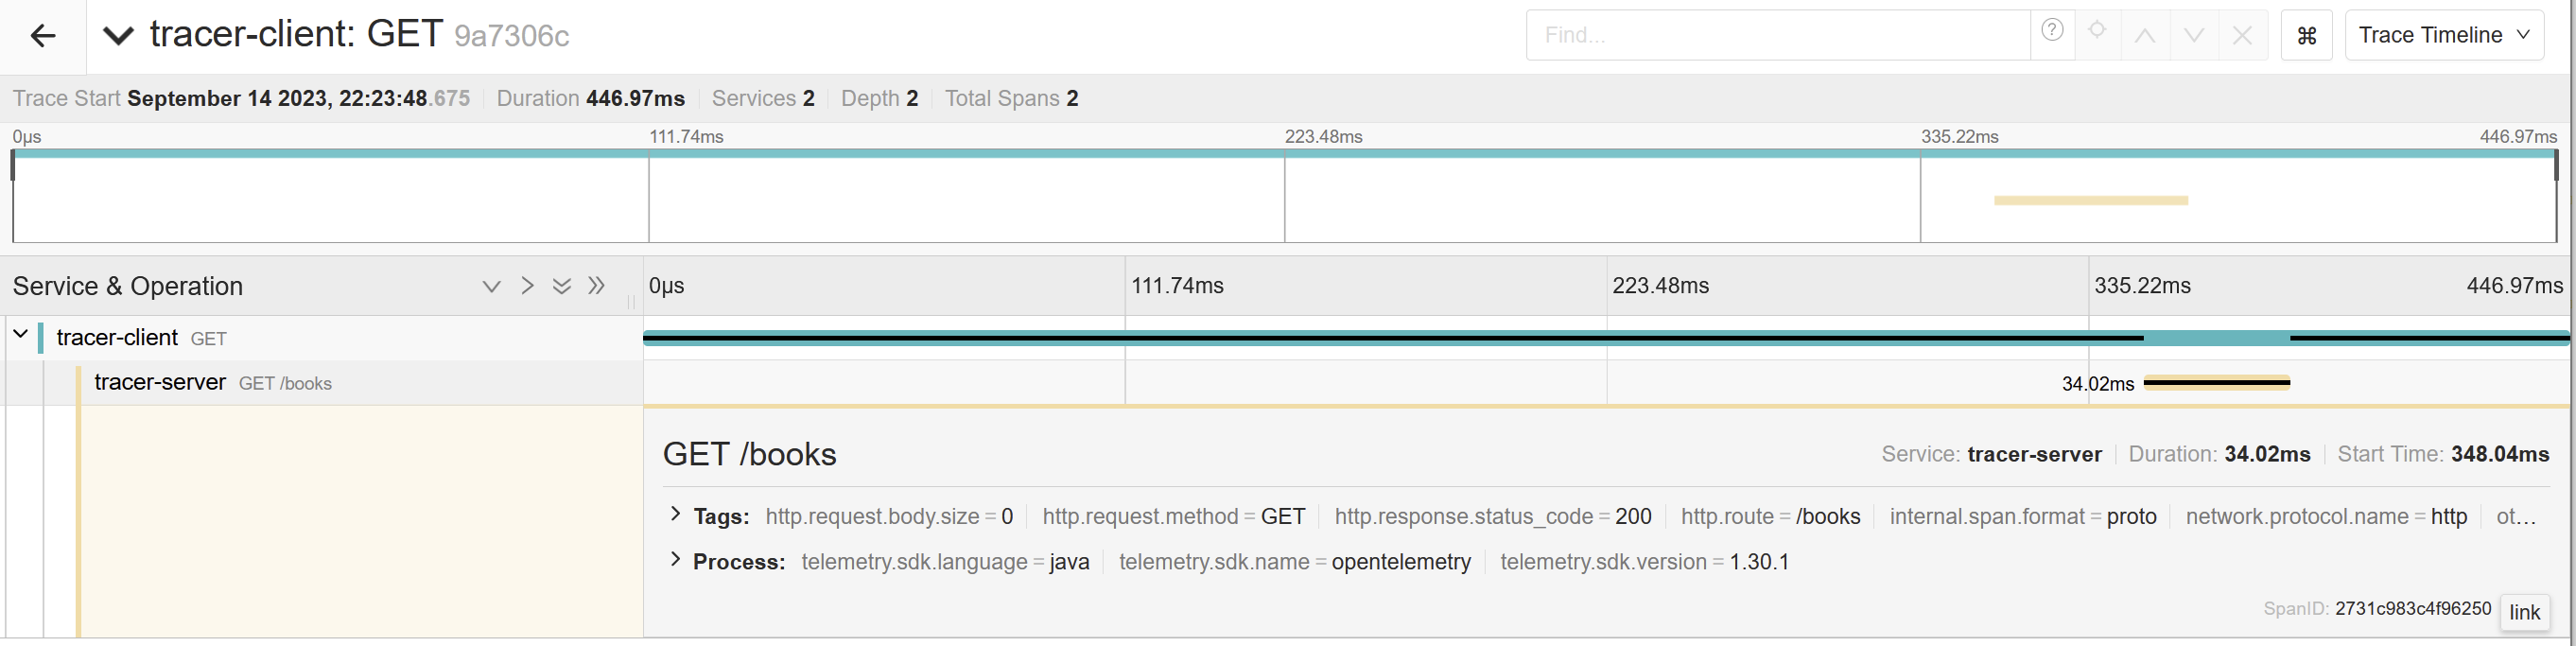
Example #1: Client and Server with default distributed tracing configuredIn the first example we are going to see the effect of using default configuration on the client and on the server, with only ObservationClientProvider and ObservationProvider registered. The JAX-RS resource endpoint is pretty basic stubbed method: @Produces( { MediaType.APPLICATION_JSON } )
@GET
public Collection<Book> getBooks() {
return Arrays.asList(
new Book("Apache CXF Web Service Development", "Naveen Balani, Rajeev Hathi")
);
}
The client is as simple as that: final Response response = client
.target("http://localhost:8282/books")
.request()
.accept(MediaType.APPLICATION_JSON)
.get();
The actual invocation of the request by the client (with service name tracer-client) and consequent invocation of the service on the server side (service name tracer-server) is going to generate the following sample traces (taken from Jaeger UI):
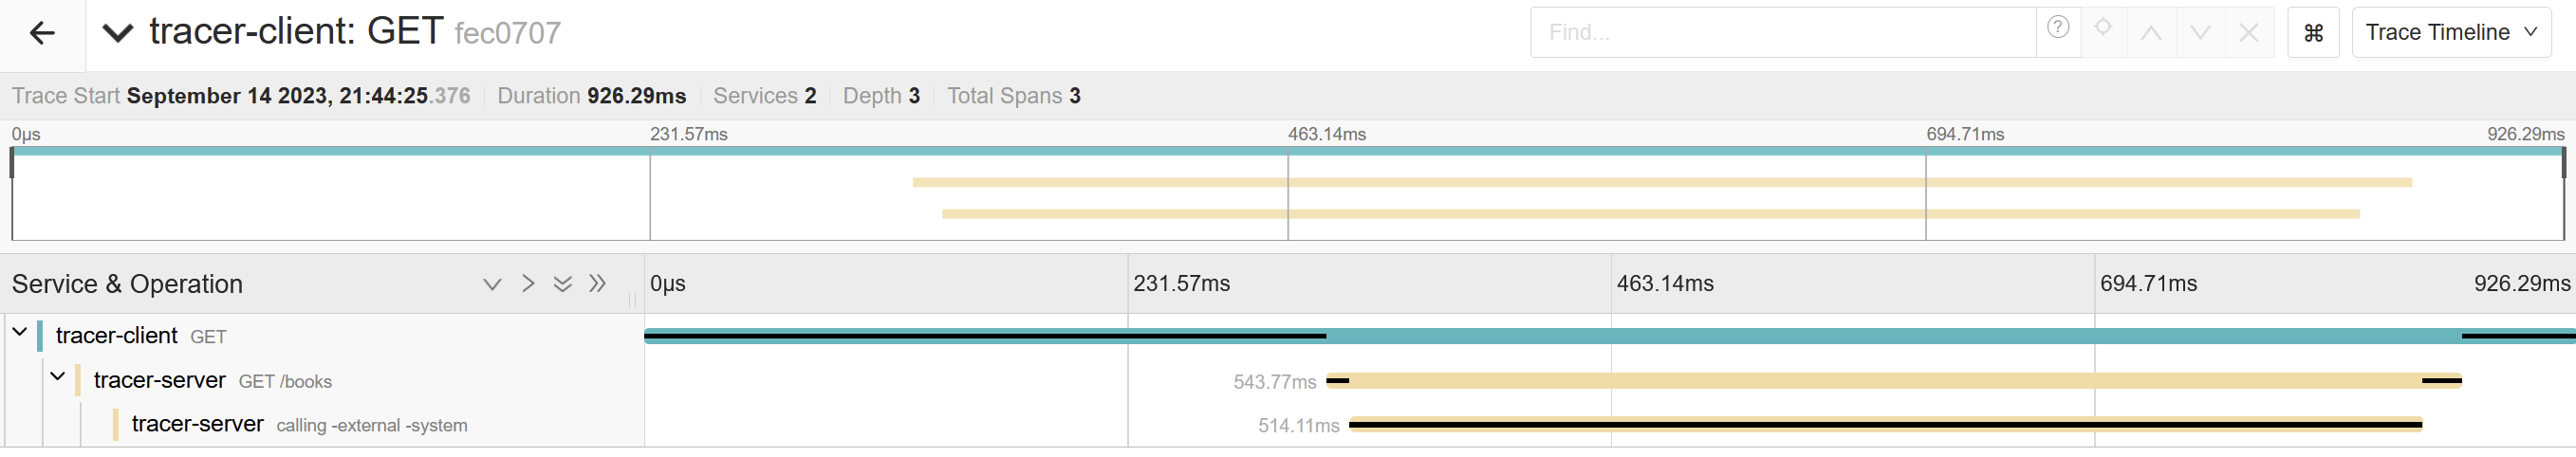
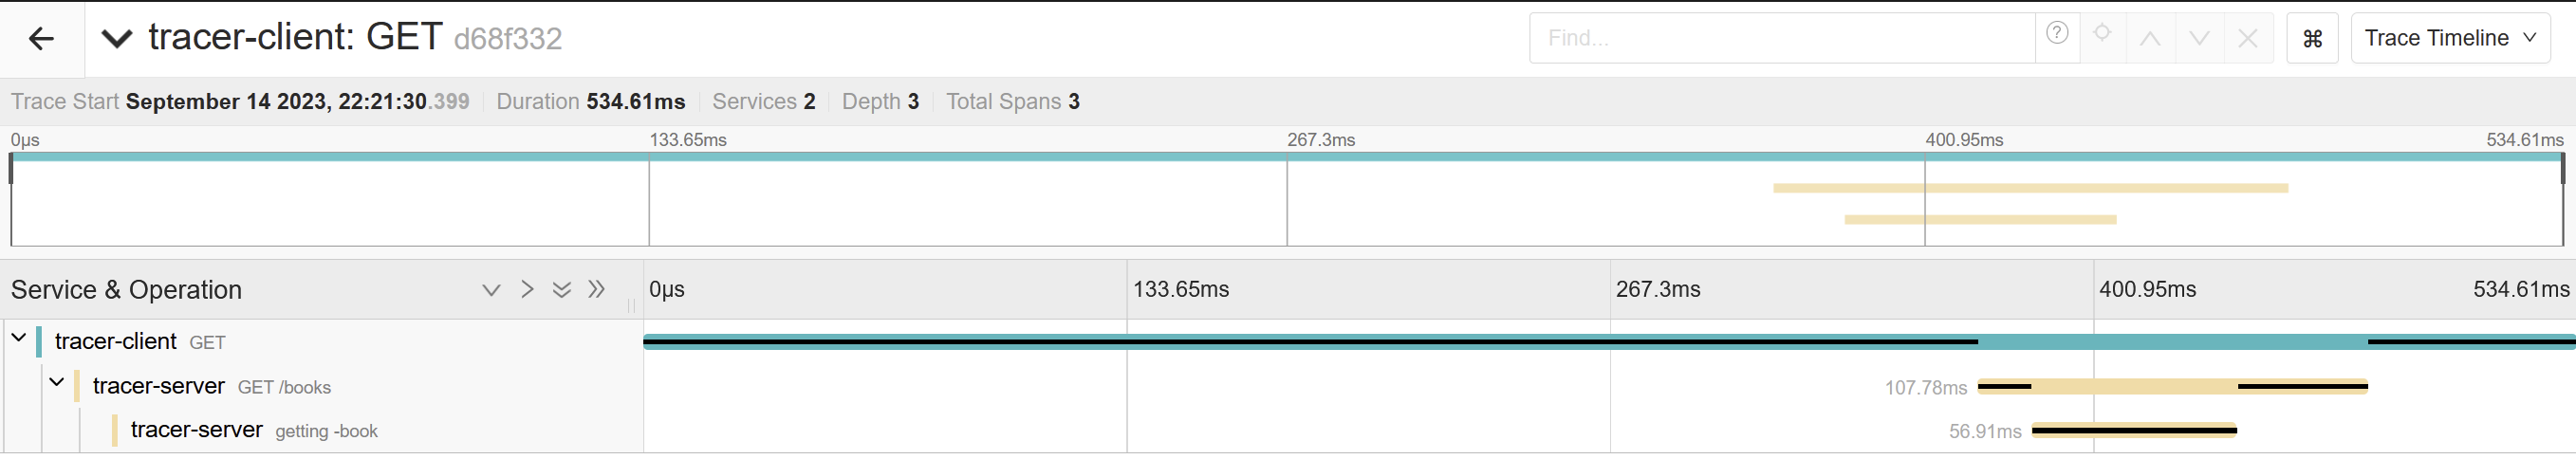
Example #2: Client and Server with nested traceIn this example server-side implementation of the JAX-RS service is going to call an external system (simulated as a simple delay of 500ms) within its own span. The client-side code stays unchanged. @Produces( { MediaType.APPLICATION_JSON } )
@GET
public Collection<Book> getBooks(@Context final TracerContext tracer) throws Exception {
try(final ObservationScope scope = tracer.startSpan("Calling External System")) {
// Simulating a delay of 500ms required to call external system
Thread.sleep(500);
return Arrays.asList(
new Book("Apache CXF Web Service Development", "Naveen Balani, Rajeev Hathi")
);
}
}
The actual invocation of the request by the client (with service name tracer-client) and consequent invocation of the service on the server side (service name tracer-server) is going to generate the following sample traces (taken from Jaeger UI):
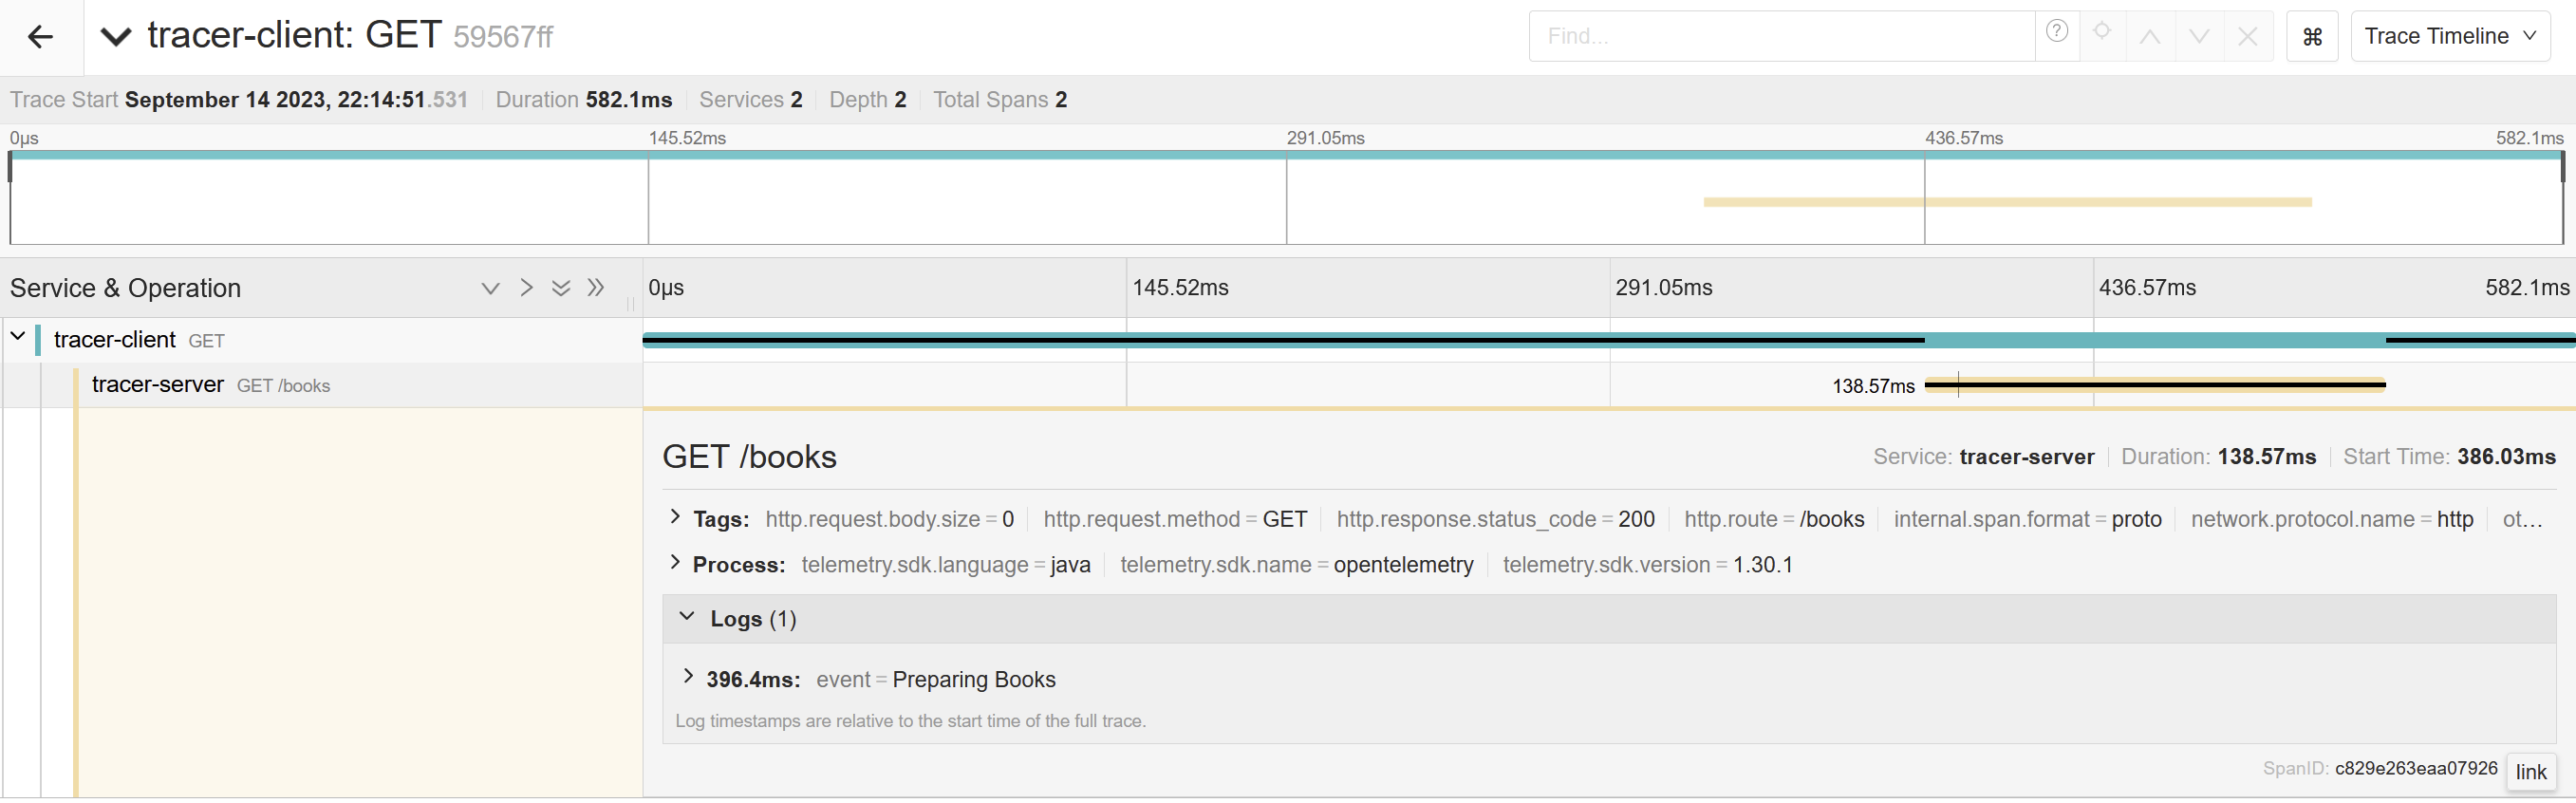
Example #3: Client and Server trace with annotationsIn this example server-side implementation of the JAX-RS service is going to add timeline to the active span. The client-side code stays unchanged. @Produces( { MediaType.APPLICATION_JSON } )
@GET
public Collection<Book> getBooks(@Context final TracerContext tracer) throws Exception {
tracer.timeline("Preparing Books");
// Simulating some work using a delay of 100ms
Thread.sleep(100);
return Arrays.asList(
new Book("Apache CXF Web Service Development", "Naveen Balani, Rajeev Hathi")
);
}
The actual invocation of the request by the client (with service name tracer-client) and consequent invocation of the service on the server side (service name traceser-server) is going to generate the following sample traces (taken from Jaeger UI):
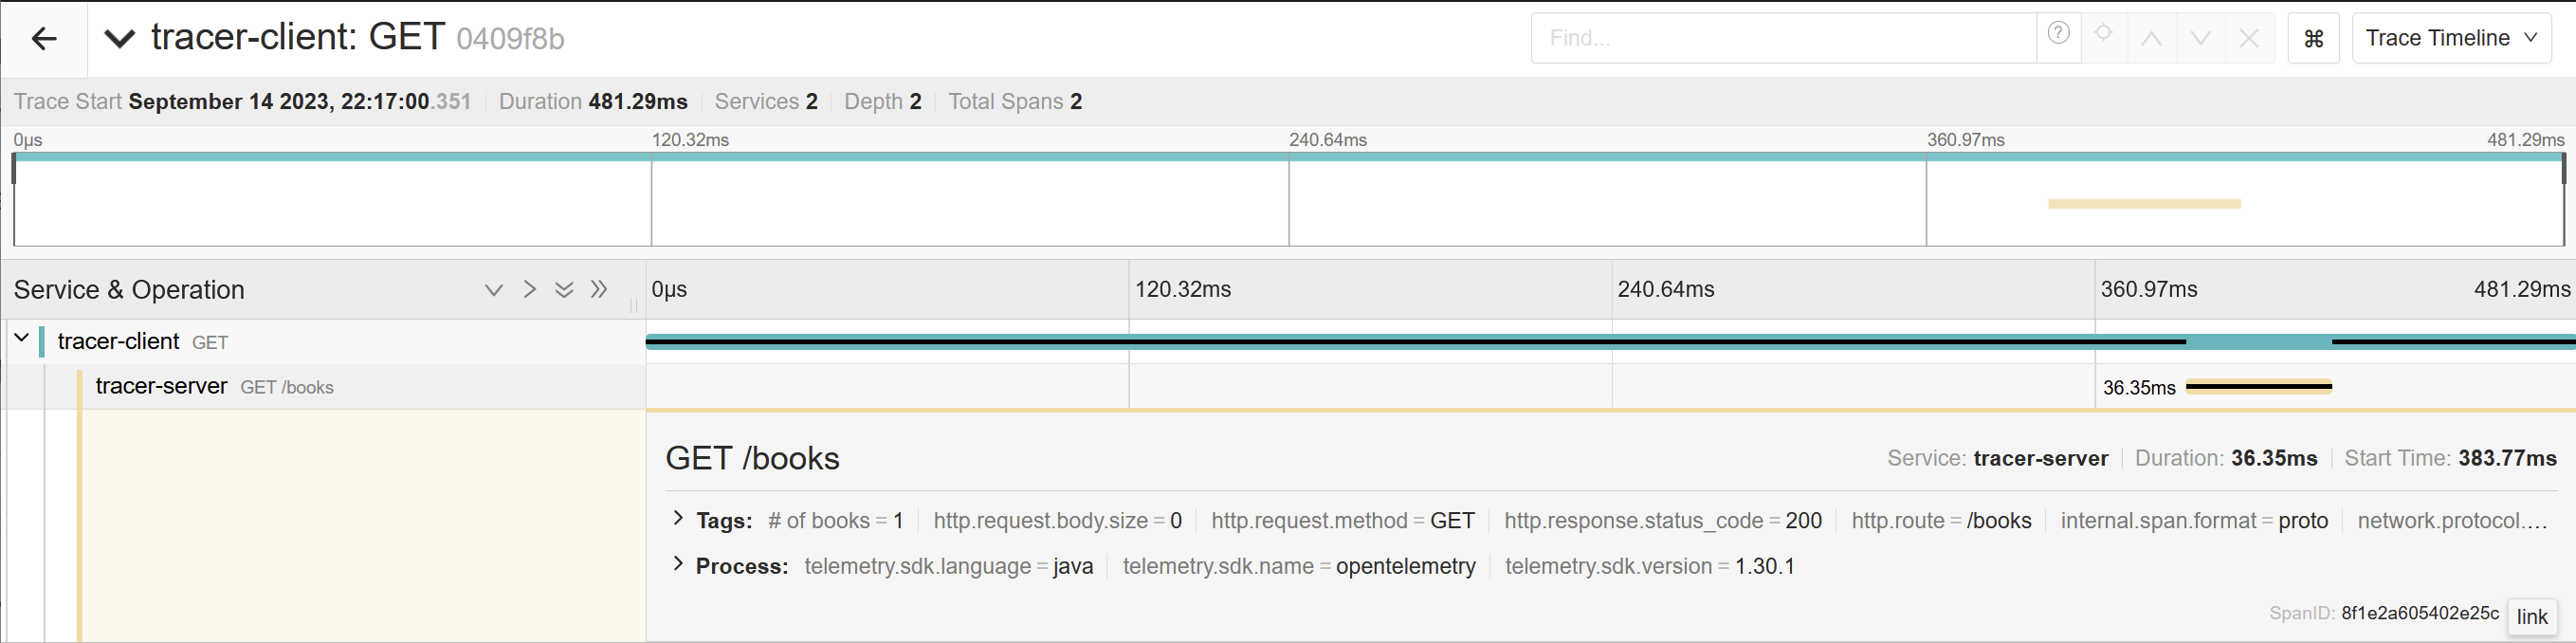
Please notice that timelines are treated as logs events in Jaeger. Example #4: Client and Server with binary annotations (key/value)In this example server-side implementation of the JAX-RS service is going to add key/value annotations to the active span. The client-side code stays unchanged. @Produces( { MediaType.APPLICATION_JSON } )
@GET
public Collection<Book> getBooks(@Context final TracerContext tracer) throws Exception {
final Collection<Book> books = Arrays.asList(
new Book("Apache CXF Web Service Development", "Naveen Balani, Rajeev Hathi")
);
tracer.annotate("# of books", Integer.toString(books.size()));
return books;
}
The actual invocation of the request by the client (with service name tracer-client) and consequent invocation of the service on the server side (service name tracer-server) is going to generate the following sample server trace properties (taken from Jaeger UI):
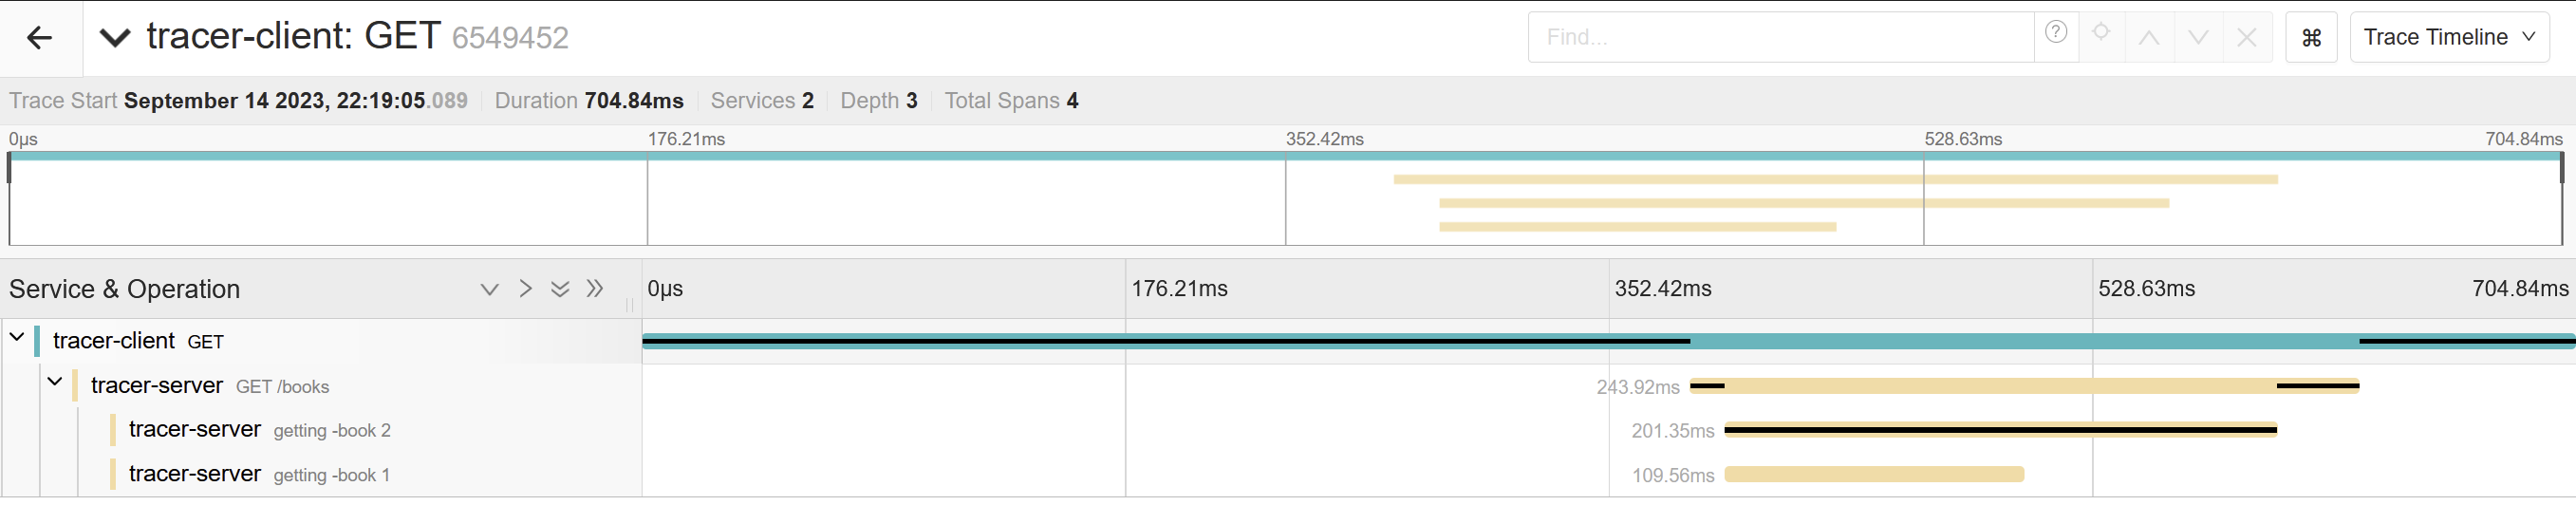
Example #5: Client and Server with parallel trace (involving thread pools)In this example server-side implementation of the JAX-RS service is going to offload some work into thread pool and then return the response to the client, simulating parallel execution. The client-side code stays unchanged. @Produces( { MediaType.APPLICATION_JSON } )
@GET
public Collection<Book> getBooks(@Context final TracerContext tracer) throws Exception {
final Future<Book> book1 = executor.submit(
tracer.wrap("Getting Book 1", new Traceable<Book>() {
public Book call(final TracerContext context) throws Exception {
// Simulating a delay of 100ms required to call external system
Thread.sleep(100);
return new Book("Apache CXF Web Service Development",
"Naveen Balani, Rajeev Hathi");
}
})
);
final Future<Book> book2 = executor.submit(
tracer.wrap("Getting Book 2", new Traceable<Book>() {
public Book call(final TracerContext context) throws Exception {
// Simulating a delay of 100ms required to call external system
Thread.sleep(200);
return new Book("Developing Web Services with Apache CXF and Axis2",
"Kent Ka Iok Tong");
}
})
);
return Arrays.asList(book1.get(), book2.get());
}
The actual invocation of the request by the client (with service name tracer-client) and consequent invocation of the service on the server side (process name tracer-server) is going to generate the following sample traces (taken from Jaeger UI):
Example #6: Client and Server with asynchronous JAX-RS service (server-side)In this example server-side implementation of the JAX-RS service is going to be executed asynchronously. It poses a challenge from the tracing prospective as request and response are processed in different threads (in general). At the moment, Apache CXF does not support the transparent tracing spans management (except for default use case) but provides the simple ways to do that (by letting to transfer spans from thread to thread). The client-side code stays unchanged. @Produces( { MediaType.APPLICATION_JSON } )
@GET
public void getBooks(@Suspended final AsyncResponse response, @Context final TracerContext tracer) throws Exception {
tracer.continueSpan(new Traceable<Future<Void>>() {
public Future<Void> call(final TracerContext context) throws Exception {
return executor.submit(
tracer.wrap("Getting Book", new Traceable<Void>() {
public Void call(final TracerContext context) throws Exception {
// Simulating a processing delay of 50ms
Thread.sleep(50);
response.resume(
Arrays.asList(
new Book("Apache CXF Web Service Development", "Naveen Balani, Rajeev Hathi")
)
);
return null;
}
})
);
}
});
}
The actual invocation of the request by the client (with service name tracer-client) and consequent invocation of the service on the server side (service name tracer-server) is going to generate the following sample traces (taken from Jaeger UI):
Example #7: Client and Server with asynchronous invocation (client-side)In this example server-side implementation of the JAX-RS service is going to be the default one: @Produces( { MediaType.APPLICATION_JSON } )
@GET
public Collection<Book> getBooks() {
return Arrays.asList(
new Book("Apache CXF Web Service Development", "Naveen Balani, Rajeev Hathi")
);
}
While the JAX-RS client implementation is going to perform the asynchronous invocation: final Future<Response> future = client
.target("http://localhost:8282/books")
.request()
.accept(MediaType.APPLICATION_JSON)
.async()
.get();
In this respect, there is no difference from the caller prospective however a bit more work is going under the hood to transfer the active tracing span from JAX-RS client request filter to client response filter as in general those are executed in different threads (similarly to server-side asynchronous JAX-RS resource invocation). The actual invocation of the request by the client (with service name tracer-client) and consequent invocation of the service on the server side (service name tracer-server) is going to generate the following sample traces (taken from Jaeger UI):
Distributed Tracing with Micrometer Observation and JAX-WS supportDistributed tracing in the Apache CXF is build primarily around JAX-RS 2.x implementation. However, JAX-WS is also supported but it requires to write some boiler-plate code and use Micrometer Observation APIs directly (the JAX-WS integration is going to be enhanced in the future). Essentially, from the server-side prospective the in/out interceptors, ObservationStartInterceptor and ObservationStopInterceptor respectively, should be configured as part of interceptor chains, either manually or using ObservationFeature. For example: final ObservationRegistry observationRegistry = ObservationRegistry.create(); // Configure tracing bridge, propagators, etc... final JaxWsServerFactoryBean sf = new JaxWsServerFactoryBean(); ... sf.getFeatures().add(new ObservationFeature( observationRegistry )); ... sf.create(); Similarly to the server-side, client-side needs own set of out/in interceptors, ObservationClientStartInterceptor and ObservationClientStopInterceptor (or ObservationClientFeature). Please notice the difference from server-side: ObservationClientStartInterceptor becomes out-interceptor while ObservationClientStopInterceptor becomes in-interceptor. For example: final ObservationRegistry observationRegistry = ObservationRegistry.create(); // Configure tracing bridge, propagators, etc... final JaxWsProxyFactoryBean sf = new JaxWsProxyFactoryBean(); ... sf.getFeatures().add(new ObservationClientFeature(observationRegistry)); ... sf.create(); Accessing Micrometer Observation APIsThe Apache CXF abstracts as much of the tracer-specific APIs behind TracerContext as possible. However, sometimes there is a need to get access to Micrometer Observation APIs in order to leverages the rich set of available instrumentations. To make it possible, TracerContext has a dedicated unwrap method which returns underlying Tracer instance. The snippet below shows off how to use this API and use Micrometer Observation instrumentation for OpenFeign client through MicrometerObservationCapability. @GET
@Path("/search")
@Produces(MediaType.APPLICATION_JSON)
public JsonObject search(@QueryParam("q") final String query, @Context final TracerContext tracing) throws Exception {
final GoogleBooksApi api = Feign
.builder()
.addCapability(new MicrometerObservationCapability(tracing.unwrap(ObservationRegistry.class)))
.target(GoogleBooksApi.class, "https://www.googleapis.com");
final feign.Response response = api.search(query);
try (final Reader reader = response.body().asReader(StandardCharsets.UTF_8)) {
return Json.createReader(reader).readObject();
}
}
Using non-JAX-RS clientsThe Apache CXF uses native Micrometer Observation capabilities so the existing instrumentations for different HTTP clients work as expected. The usage of only JAX-RS client is not required. Samples |